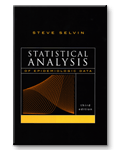
Statistical Analysis of Epidemiologic Data, 3rd Edition
Book Info
Author: Steve Selvin
公卫论坛 Publisher: Oxford University Press
Copyright: 2004
ISBN-10: 0-19-517280-9
ISBN-13: 978-0-19-517280-5
Pages: 492; hardcover
Price: $50.00
Comment from the Stata technical group
Statistical Analysis of Epidemiologic Data provides basic material for a one- or two-term course in statistical methods for epidemiology and is ideal for graduate students in the medical sciences who have had basic courses in statistics and epidemiology. Since the methods covered are directly available in most statistical software, including Stata, the mathematical discussions are minimal. Real-data examples are used to motivate the discussion, allowing the reader to replicate the analyses performed and to compare and contrast different methods applied to the same data. 公卫百科
Covered topics include an overview of the relevant terminology (e.g., rates, prevalence, hazard functions, and matched case–control data), variation and bias, power and sample-size calculations for standard univariate analysis, cohort analysis, the analysis of contingency tables, logistic regression, Poisson regression, the analysis of matched data, and survival analysis, including the Cox model.
公卫考场
Table of contents
1 Measures of Risk: Rates and Probabilities Rates
Probabilities
Incidence and prevalence
Survival probabilities and hazard rates
Statistical properties of probabilities calculated from mortality or disease data 公卫百科
Analysis of rates: smoothing, transforming, and adjusting
2 Variation and Bias
A simple model The t-test
Selection bias
Confounder bias
Ecologic bias
Comparison of k groups
Interaction contrasts
Two-way analysis
Misclassification bias 公卫论坛
3 Statistical Power and Sample Size Calculations
Technical details
Normal distribution: sample mean
Poisson distribution: relative risk
Sample size: one-sample test of a proportion
Sample size: two-sample test of proportions
Loss of statistical power and bias from grouping continuous data 公卫家园
4 Cohort Data: Description and Illustration
Cohort effect: model
Birth cohort effect and proportional mortality data
Median polish analysis
Mean polish analysis
Four examples
Cohort effect: prostatic cancer data
5 Spatial Data: Analysis and Estimation 公卫论坛
Poisson model
Nearest-neighbor analysis
Transformed maps
Spatial distribution about a point
Time/distance spatial analysis
Randomization test
Time/distance: randomization test
Bootstrap estimation and analysis
6 The 2 x k Table and the 2 x 2 x 2 Table 公卫人
The 2 x k contingency table
Independence and homogeneity
Regression
Two-sample model: comparison of two means
Ridit probability analysis
The 2 x 2 x 2 contingency table
7 The Analysis of Contingency Table Data: Logistic Model I
公卫人
The simplest model: discrete case
The 2 x 2 x 2 table
The 2 x k table
The 2 x 2 x k table
The multiway table
Goodness-of-fit: discrete case
Summarizing a series of 2 x 2 tables
8 The Analysis of Binary Data: Logistic Model II 公卫家园
Simple logistic regression: continuous cas
e Bivariate logistic regression
Logistic regression coefficients: general considerations
"Centering"
The WCGS additive logistic model
Case/control sampling
9 The Analysis of Count Data: Poisson Model 公卫考场
Simplest Poisson model
Poisson model: technical description
Illustration of the Poisson model
Poisson model adjusted rate: Hodgkins disease
Poisson regression: CHD risk by smoking and behavior type
Count data: application of the Poisson model 公卫论坛
Poisson regression: a two-way classification
Poisson regression: a three-way classification
10 The Analysis of Matched Data: Three Approaches
Frequency matching
Poststratification
Matched analysis: continuous variable
Matched case/control pairs: binary risk factor 公卫人
Confidence interval for the odds ratio
Evaluating the estimated odds ratio
Disregarding matching
Interaction with the matching variable
Matched sets using more than one control
Matched analysis: multilevel categorical risk factor
Conditional logistic analysis 公卫百科
11 Life Table Analysis: An Introduction
Complete, current life table: construction
Life table survival function
Life table hazard function
Life tables: three applications of life table techniques
Competing Risks
12 Survival Data: Estimation of Risk 公卫百科
Parametric model
Age adjustment of rates
Censored and truncated data
Mean survival time: parametric estimate
Mean survival time: nonparametric estimate
Mean survival time from censored data
Goodness-of-fit
Two-sample data
The Wilcoxon test and the Gehan generalization to survival data 公卫论坛
13 Survival Data: Proportional Hazards Model
Simplest case
The proportional hazards model
Plotting survival curves
Four applications of a proportional hazards model
Dependence on follow-up time
Appendix
A. Description of the WCGS data set
公卫考场
B. Binomial and Poisson probability distributions
C. The odds ratio and its properties
D. Partitioning the chi-square statistic
E. Maximum likelihood estimation and likelihood functions
F. Problems
References
Index
附件列表
您所在的用户组无法下载或查看附件
词条内容仅供参考,如果您需要解决具体问题
(尤其在法律、医学等领域),建议您咨询相关领域专业人士。
如果您认为本词条还有待完善,请 编辑
上一篇 Statistical Models in Epidemiology 下一篇 Principles of Biostatistics, 2nd Edition


